
Full Stack Observability
Achieve 360° Visibility with Observelite’s Full Stack Observability
Get complete transparency across your entire tech stack.
Monitor, analyze, and optimize every layer of your infrastructure and application.
What is Full Stack Observability with Observelite?
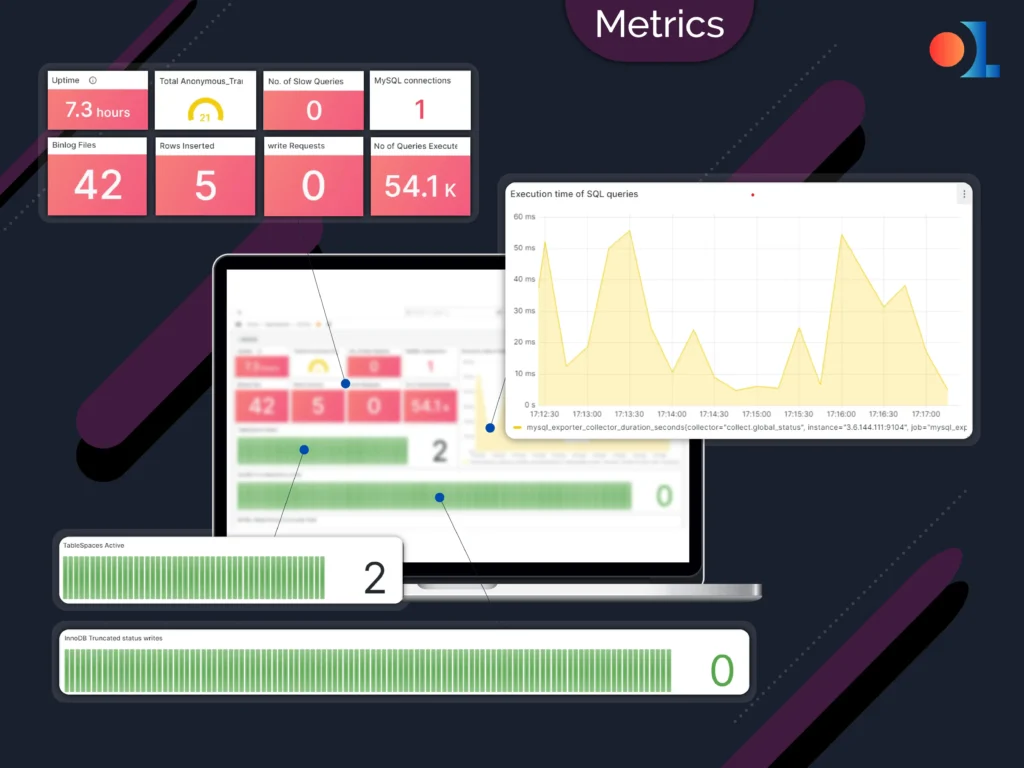
METRICS
⚊ Real-Time Performance Insights: Track vital metrics such as CPU usage, memory consumption, and network traffic in real-time.
⚊ Threshold Alerts: Set customized thresholds for key metrics to receive instant notifications when something goes awry.
⚊ Trend Analysis: Analyze historical data to identify patterns and forecast potential issues before they impact users.
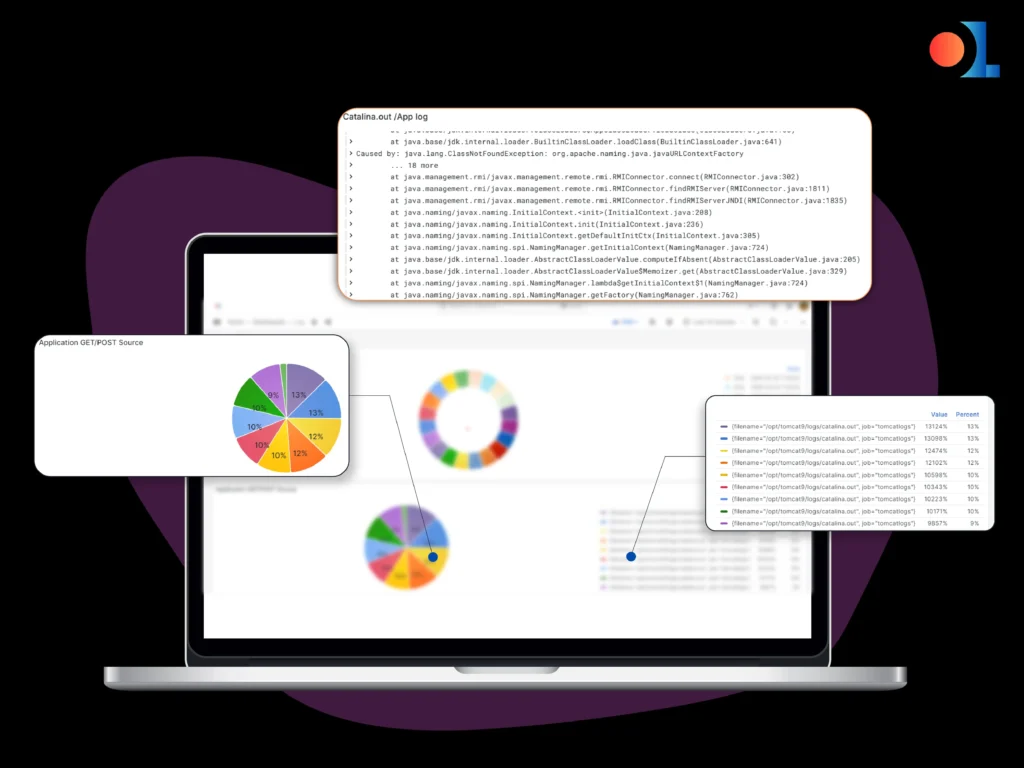
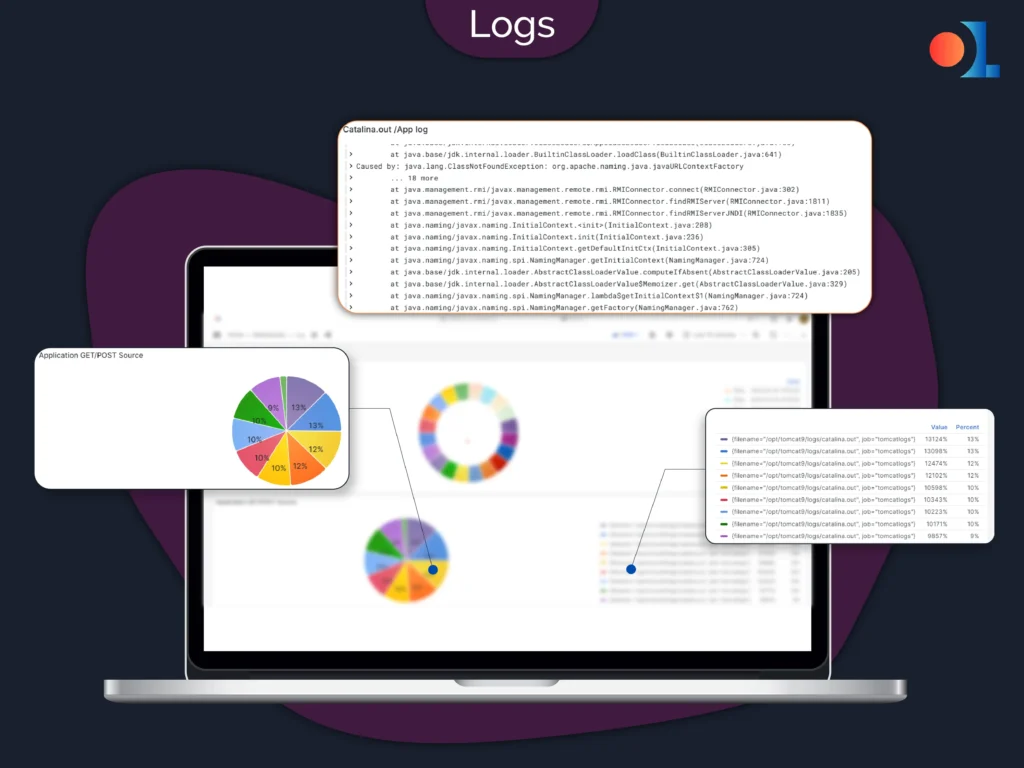
LOGS
⚊ Centralized Log Management: Aggregate logs from all sources into a single, searchable interface, simplifying the troubleshooting process.
⚊ Contextual Correlation: Correlate log data with metrics and traces to gain a holistic view of system behavior during specific events.
⚊ Real-Time Log Alerts: Set up real-time alerts for specific log patterns that indicate potential issues, enabling proactive problem resolution.
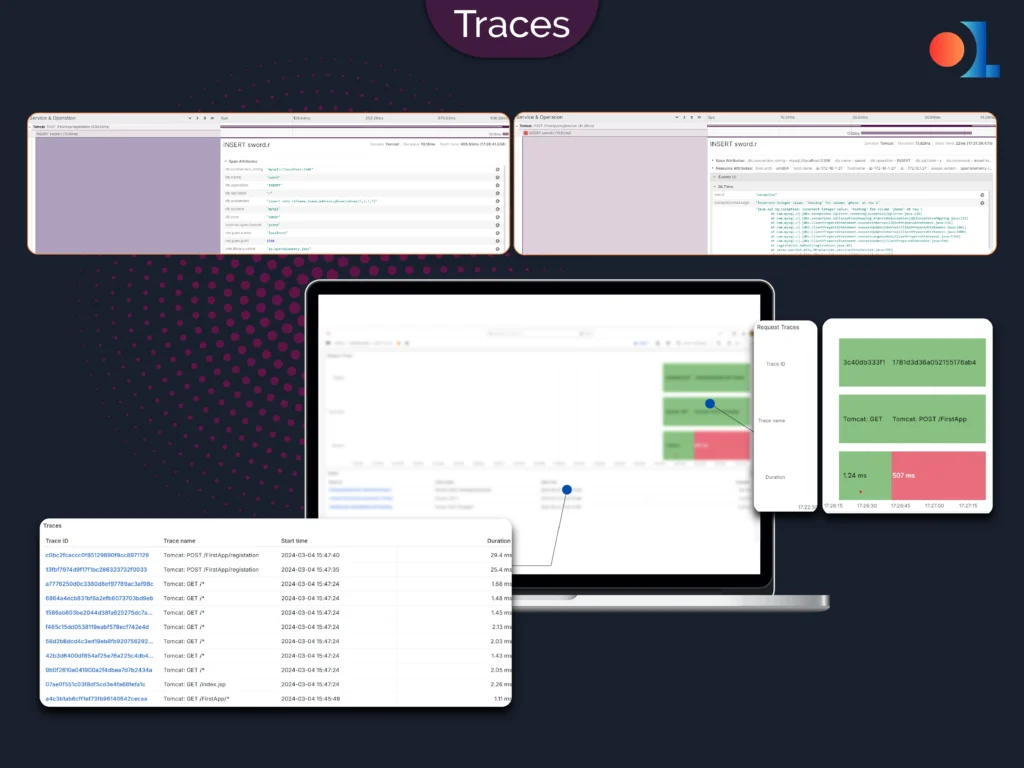
TRACES
⚊ End-to-End Visibility: Trace the journey of every request from the user interface to the backend services, uncovering bottlenecks.
⚊ Root Cause Analysis: Quickly identify which service or component is causing performance issues by following the trace.
⚊ Detailed Transaction Insights: Gain a granular view of each transaction’s performance, including latency, errors, and throughput.
User Experience is the Starting Point for Success
Monitor User Interactions
Track every click, scroll, and input to understand how users navigate your applications and identify areas for improvement.
Detect Anomalies Early
Use AI-driven analytics to spot unusual user behavior that could indicate a potential problem, and take corrective action immediately.
Analyze Performance Impact
See how backend performance impacts user experience in real-time, allowing you to address issues before they affect your customers.
Optimize Load Times
Ensure that your application loads quickly across all devices by monitoring and optimizing each step of the user’s journey.
Enhance User Satisfaction
Continuously monitor user experience metrics and make data-driven improvements to keep users engaged and satisfied.
Application Monitoring at the Code Level
⚊ Monitor Resource Utilization: Track how efficiently your code uses system resources, and make optimizations to improve speed and efficiency.
⚊ Error Tracking and Resolution: Automatically detect and log errors down to the specific line of code, making debugging faster and more precise.
⚊ Continuous Code Optimization: Use real-time insights to refine your code continuously, ensuring that your applications remain fast and reliable.
⚊ Version Comparison: Compare performance across different versions of your application to understand the impact of recent changes and rollbacks.
Seamless Cloud and Infrastructure Monitoring
⚊ Real-Time Performance Tracking: Continuously monitor the performance of your cloud services and infrastructure, ensuring they meet the demands of your applications.
⚊ Capacity Planning: Use historical and real-time data to predict future resource needs and scale your infrastructure accordingly.
⚊ Automated Issue Resolution: Leverage automation to detect and resolve infrastructure issues before they impact application performance.
⚊ Cross-Platform Visibility: Gain a unified view of your entire cloud ecosystem, including multi-cloud and hybrid environments, to manage your infrastructure more effectively.

Visualize Connections Across Your Stack
Identify Points of Failure: Quickly spot single points of failure or weak links in your infrastructure that could lead to performance issues.
End-to-End Tracing: Trace transactions across your entire stack to see how data flows through your system and identify any bottlenecks or inefficiencies.
Unified View of Operations: Integrate data from metrics, logs, and traces into a single dashboard to get a holistic view of your entire IT environment.
Proactive Optimization: Use insights from your observability data to proactively optimize system performance, ensuring everything runs smoothly.
