Modern software doesn’t live in a single file or server anymore. It lives in containers, moves across distributed applications, and evolves daily. That’s why observability in microservices has become essential — not optional.
Observability gives teams a real-time window into how services behave, where failures occur, and why performance drops — without manually sifting through log files or guessing what went wrong.
In this guide on observability in microservices, we’ll break down 7 smart ways to gain deeper visibility and control in modern distributed systems:
- What observability means in microservices
- Why it’s different from monitoring
- The role of metrics, logs, and traces
- Key challenges in distributed systems
- And how to make observability actually work
Key Area #1: What Is Observability in Microservices?
Observability refers to your ability to understand the internal state of a system based on the outputs it produces — like logs, metrics, and traces.
In microservices, this becomes especially critical because:
- Services are small and numerous
- Communication is often async or API-based
- Failures don’t happen in isolation
- Deployments are continuous and fast
Traditional monitoring can tell you something broke. Observability tells you what, where, and why — even across multiple services and containers.
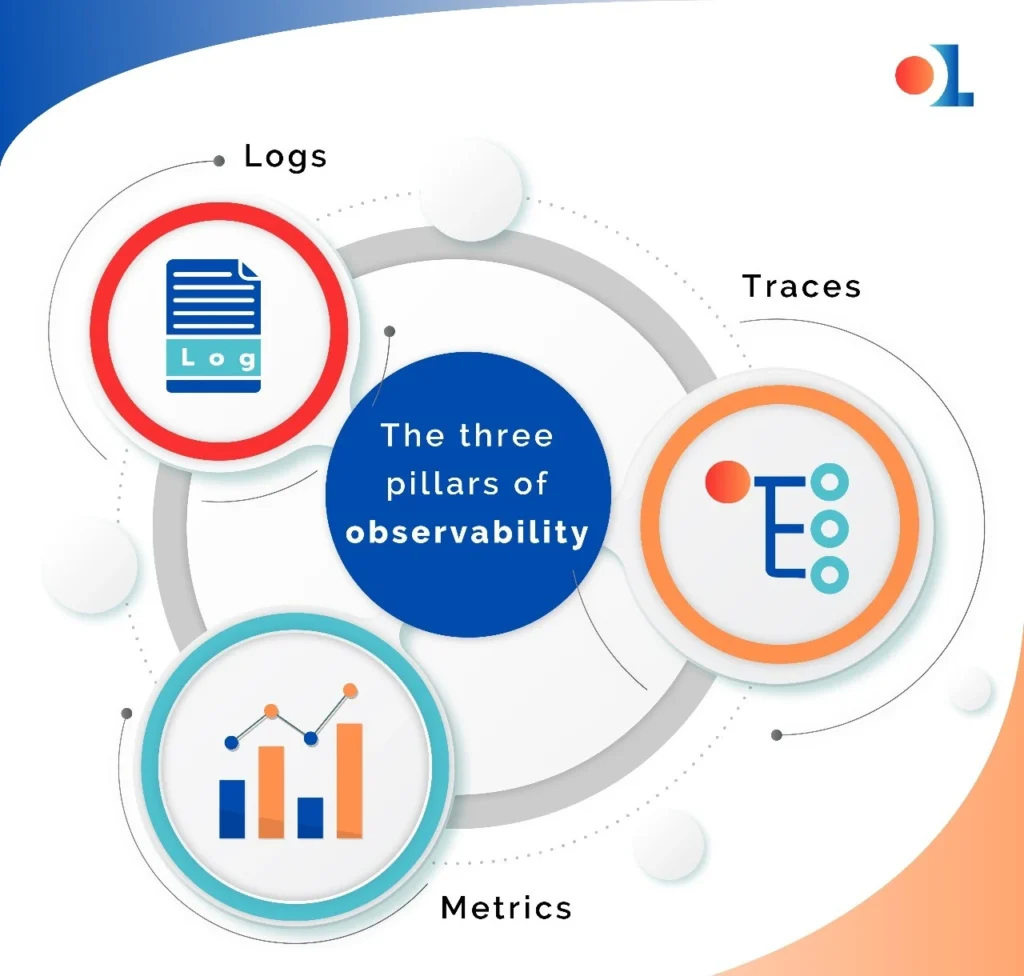
Key Area #2: The Three Pillars of Observability: Metrics, Logs, and Traces
To achieve true observability in a microservices architecture, you need to capture and correlate three core telemetry data types:

Metrics
Quantitative measurements like response times, CPU usage, request counts.
They help answer:
Is my system healthy?
Logs
Structured or unstructured records of events.
They help answer:
What exactly happened?
Traces
Records of a single request traveling across services.
They help answer:
Where did the request slow down or fail?
Distributed tracing connects the dots between services so you can pinpoint where issues occur in a request flow — essential for root cause analysis (RCA). It’s one of the most powerful pillars of observability in microservices, offering full visibility across service-to-service interactions.
Key Area #3: Observability in Microservices vs. Monitoring: What’s the Difference?
Monitoring is about tracking known issues using alerts and thresholds.
Observability is about investigating unknowns by exploring telemetry data.
| Monitoring | Observability |
| Detects known failures | Explores unknown behaviors |
| Based on static thresholds | Relies on dynamic telemetry |
| Shows symptoms | Helps find root cause |
Observability in microservices is no longer a luxury — it’s a competitive necessity.
Key Area #4: Why Microservices Make Observability Harder
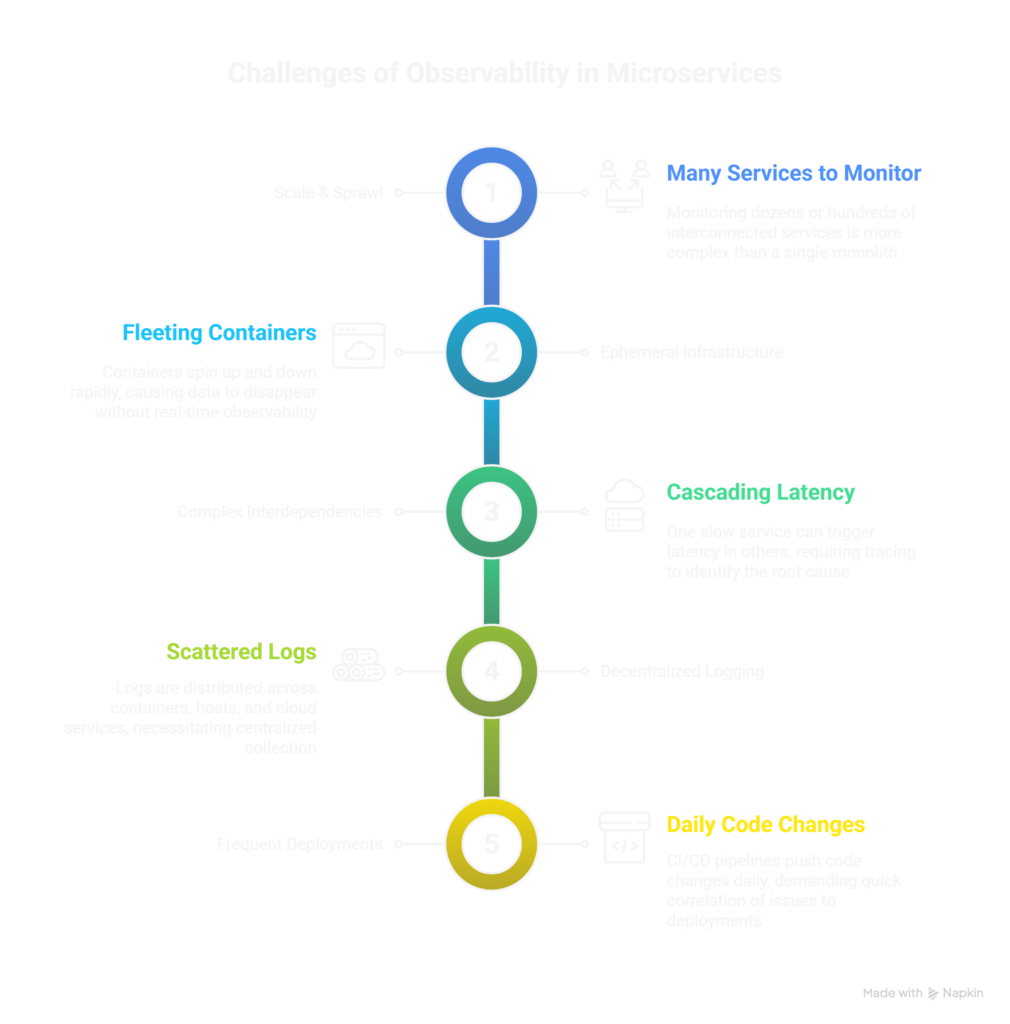
Observability in monoliths is hard. In microservices, it’s even harder. Here’s why:

- Scale & Sprawl
You’re no longer watching one app — you’re watching dozens or hundreds of interconnected services. - Ephemeral Infrastructure
Containers spin up and down in seconds. Without real-time observability, data disappears. - Complex Interdependencies
One slow service can cascade latency through others. You need to trace these links. - Decentralized Logging
Logs are scattered across containers, hosts, cloud services — making central data collection crucial. - Frequent Deployments
With CI/CD, code changes hit production daily. You must correlate issues to changes quickly.
Key Area #5: Key Capabilities Your Observability Stack Must Have
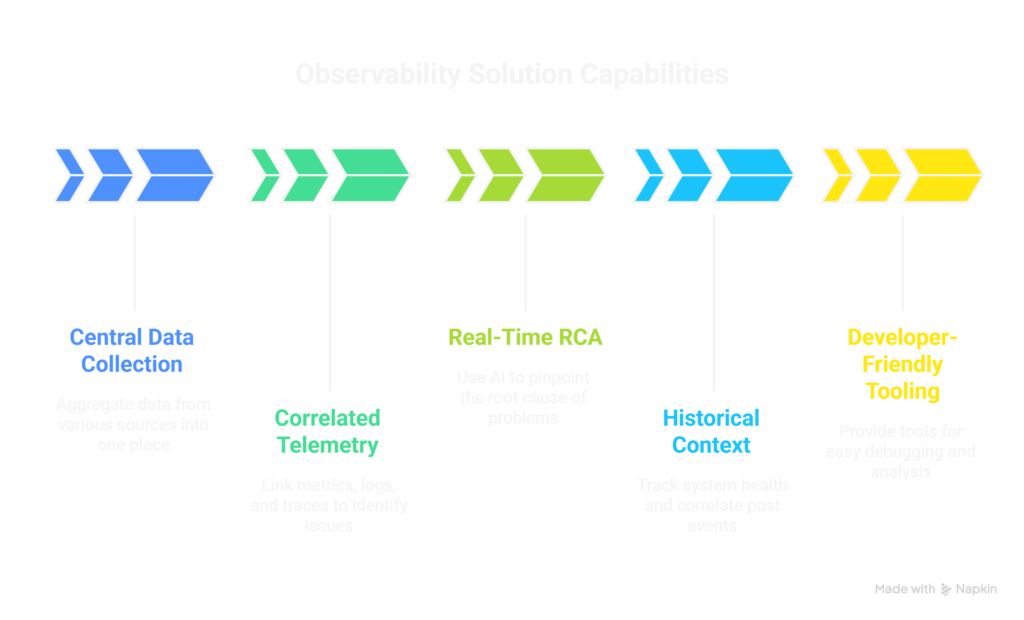
To tame microservices, your observability solution needs more than pretty dashboards. It needs to provide:

Central Data Collection
Aggregate logs, metrics, and traces from all sources — containers, VMs, serverless — into one place.
Link a spike in latency (metric) to a specific log error and a trace that crossed multiple services.
Real-Time RCA (Root Cause Analysis)
Use AI or automated tracing to identify the exact service or code change that caused an issue.
Historical Context
Track system health over time and correlate past events to current performance bottlenecks.
Developer-Friendly Tooling
APIs, SDKs, and intuitive dashboards help engineers debug without digging through multiple systems.
Key Area #6: Use Observability to Detect What Monitoring Misses
Some real-world issues that observability helps catch:
- A single misconfigured container sending bad requests to upstream services
- Intermittent latency spikes caused by a third-party API
- A degraded service that’s technically “up” but failing 20% of requests
- Memory leaks that accumulate across several deployments
Without observability, these issues would go undetected — or take hours to resolve. With it, teams get the full picture fast.
Key Metrics to Monitor for Observability in Microservices
To build useful observability dashboards, start with these critical microservice metrics:
| Metric | Why It Matters |
| Latency | Indicates slowdowns or bottlenecks |
| Request Rate (RPS) | Measures traffic load and patterns |
| Error Rate | Detects failing services early |
| Saturation (CPU/Memory) | Shows resource exhaustion |
| Availability/Uptime | Tracks service health and SLAs |
Use golden signals — latency, traffic, errors, and saturation — as your baseline.
Don’t Forget Service Availability & Performance
Your observability efforts should always tie back to:
- System health — is the infrastructure holding up under load?
- Service availability — are users getting the functionality they need?
- Performance bottlenecks — is anything slowing the experience down?
Think of observability as your early warning system, not just a post-mortem tool.
Key Area #7: Correlation Beats Collection
Many teams collect telemetry data but don’t connect it. That’s like watching disconnected security cameras — you need a timeline of what happened, where, and why.
Correlated data means:
- A trace shows a slow request → leads to a log with an error → tied to a deployment that introduced it
- A spike in CPU in one container → links to increased garbage collection → traced to high load from a partner API
This kind of connected insight makes troubleshooting faster, easier, and less reactive.
Conclusion: Observability Is Your Superpower in Microservices
If your architecture is moving toward microservices (and it likely is), then observability isn’t optional — it’s foundational.
Whether you’re just getting started or scaling across dozens of services, the key is having the right tools in place to capture metrics, logs, and traces, and correlate them in real time.
ObserveLite APM was built for observability in microservices.
It gives teams the visibility, speed, and simplicity they need to stay ahead of issues in complex, distributed environments — without the noise.
Want to see how it works? Explore ObserveLite APM


